What makes the best movie?
Analyzing data to determine the best movies.

The Best Movie
Rating
Using data from Kaggle’s The Movies Dataset, let’s determine what makes the best movies. The Data set gives us ratings from The Movie Database(tMDb), where movies are rated out of 10. And the top 10 movies are:
| title | vote_average | vote_count |
|---|---|---|
| The Godfather | 8.50 | 6,024 |
| The Shawshank Redemption | 8.50 | 8,358 |
| Spirited Away | 8.30 | 3,968 |
| The Dark Knight | 8.30 | 12,269 |
| The Godfather: Part II | 8.30 | 3,418 |
| Schindler's List | 8.30 | 4,436 |
| One Flew Over the Cuckoo's Nest | 8.30 | 3,001 |
| Psycho | 8.30 | 2,405 |
| Fight Club | 8.30 | 9,678 |
| Life Is Beautiful | 8.30 | 3,643 |
Other Ratings
But that’s not the whole story. Included in the database is a set of 26,024,289 individual ratings by users. Since we’re not making individual movie recomendations – that’s another unit – let’s aggregate the scores into means, merge them into the movie database, and see how that compares to the tMDB ratings. After averaging, we get the following top 10.
| title | rating | num_votes |
|---|---|---|
| Sleepless in Seattle | 4.34 | 57,070 |
| Once Were Warriors | 4.27 | 67,662 |
| Hard Target | 4.26 | 13,994 |
| License to Wed | 4.23 | 60,024 |
| The Talented Mr. Ripley | 4.18 | 33,987 |
| Galaxy Quest | 4.17 | 5,453 |
| Terminator 3: Rise of the Machines | 4.17 | 87,901 |
| Local Color | 4.17 | 25,245 |
| Hannibal Rising | 4.16 | 5,199 |
| Ice Age: The Meltdown | 4.15 | 3,628 |
Revenue
It’s a very different list, with zero overlap. If only there was a way to scale or combine them. But we’re not done yet. There’s another way you could define the best movies. And this is the one the studios care about. How much money they made. The Dataset also provides revenue, so let’s see what that list looks like.
| title | revenue |
|---|---|
| Titanic | $1,845,034,188 |
| The Lord of the Rings: The Return of the King | $1,118,888,979 |
| Pirates of the Caribbean: Dead Man's Chest | $1,065,659,812 |
| Pirates of the Caribbean: On Stranger Tides | $1,045,713,802 |
| The Dark Knight | $1,004,558,444 |
| Harry Potter and the Philosopher's Stone | $976,475,550 |
| Finding Nemo | $940,335,536 |
| Harry Potter and the Half-Blood Prince | $933,959,197 |
| The Lord of the Rings: The Two Towers | $926,287,400 |
| Star Wars: Episode I - The Phantom Menace | $924,317,558 |
Adjusted Revenue
Another new list. But that’s not quite right. The value of a dollar has changed over time. 1 billion 1920 dollars isn’t the same as 1 billion 2020 dollars. So using a third dataset provided by the federal government, we can adjust the values based on the year that these movies were released.
| title | adjusted revenue |
|---|---|
| Star Wars | $3,028,727,803 |
| Titanic | $2,721,127,532 |
| E.T. the Extra-Terrestrial | $1,945,321,985 |
| The Empire Strikes Back | $1,546,829,516 |
| Jurassic Park | $1,507,846,186 |
| The Lord of the Rings: The Return of the King | $1,439,899,368 |
| The Godfather | $1,387,267,307 |
| Return of the Jedi | $1,361,232,958 |
| Star Wars: Episode I - The Phantom Menace | $1,313,638,874 |
| Harry Potter and the Philosopher's Stone | $1,305,536,965 |
PCA Rating
So now we have 3 different metrics with scales that go from 0-5 for one, to billions for another. Which should we use to determine the best movie? With the magic of principle component analysis, we don’t have to decide! After waving the PCA wand combining the ratings from 2 different databases along with the adjusted revenue, we get the following top 10 movies.
| Title | PCA |
|---|---|
| Star Wars | 8.86514 |
| Titanic | 7.50724 |
| E.T. the Extra-Terrestrial | 5.27108 |
| The Empire Strikes Back | 4.81926 |
| The Godfather | 4.75741 |
| The Lord of the Rings: The Return of the King | 4.51399 |
| Jurassic Park | 4.3515 |
| Return of the Jedi | 4.21927 |
| The Lord of the Rings: The Two Towers | 3.98178 |
| The Dark Knight | 3.87451 |
So the original Star Wars is the best movie.
Data Insights
Movies through the years
It’s been said that classic movies are better, and that modern movies are just terrible in comparison. We can graph time against the PCA rating to see if that’s true. And from this graph, it becomes clear that movies hit a high point in the 70s and really took a nose dive in the 2000s
If the Null hypothesis were that movies in 1970 were better than movies in 2000s, we would have to reject it with a calculated P value of $4.54 \times 10^{-05}$
Genres
But what else might effect a movies ratings? Are adventure movies better than Westerns? Are Romance movies better than comedies?
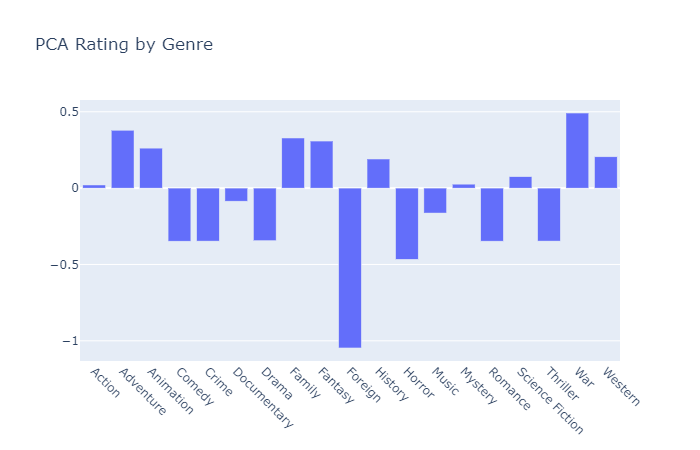
From the data, the clear loser are Foreign Films, and that War movies are a safe bet.
Budget
How about budgets? Do bigger budgets translate to better movies?
| Mean Budget | Mean Revenue | PCA | |
|---|---|---|---|
| Budget Category | |||
| [0, 500,000) | $197,962 | $15,368,653 | -0.15 |
| [500,000, 40,000,000) | $18,500,755 | $61,334,171 | -0.06 |
| [40,000,000, 100,000,000) | $61,415,816 | $186,069,871 | 0.04 |
| [100,000,000, 1,000,000,000,000) | $141,292,135 | $436,756,768 | 0.70 |
What else?
Clearly, there are other things that could affect the rating of a movie. Here are possible other insights that might be scraped from the data
-
Who is the best director of all time?
-
Which movies had the greatest return on investment given their budget and their revenue?
-
Should Directors stay in their lane? In other words, are directors who have a body of work that is majority one genre able to switch to a completely different genre and still make movies that are just as good? For example, a renowned Horror director might decide to do a romance film. How do they do? How about the other way around?